Deploy, Configure, and Monitor Traefik with Prometheus and Grafana
Traefik is my top drawer tool to solve multiple use cases while not adding additional complexity. Need a Reverse Proxy, a Let's Encrypt integration, or a Docker Swarm/Kubernetes integration then Traefik is just the tool for the job.
Traefik is just the tool that solves multiple use cases while reducing Dev and Ops efforts for deploying and maintaining applications. We should strive to make our lives easier, not more complicated.
I am continually advocating reducing the number of tools in our toolbox and reducing complexity.
We are not all deploying Google or Facebook-sized infrastructures, are we?
Traefik is my top drawer tool to solve multiple use cases without adding additional complexity. If you need a Reverse Proxy, a Let's Encrypt integration or a Docker Swarm/Kubernetes integration, then Traefik is just the tool for the job. If you wander across the interwebs any length of time Googling the above topics chances are you will stumble upon Traefik.
I have been using Traefik for quite some time across several projects. The first project I used Traefik for was this website, which I was hosting on Digital Ocean at the time, with Ghost, Traefik running the reverse proxy, and Lets Encrypt. The combination worked amazingly well and handled the front page of Hacker News.
Recently, I had the amazing opportunity to share how I use Traefik with my Docker Monitoring project which is also covered in the previous how to setup docke monitoring article.
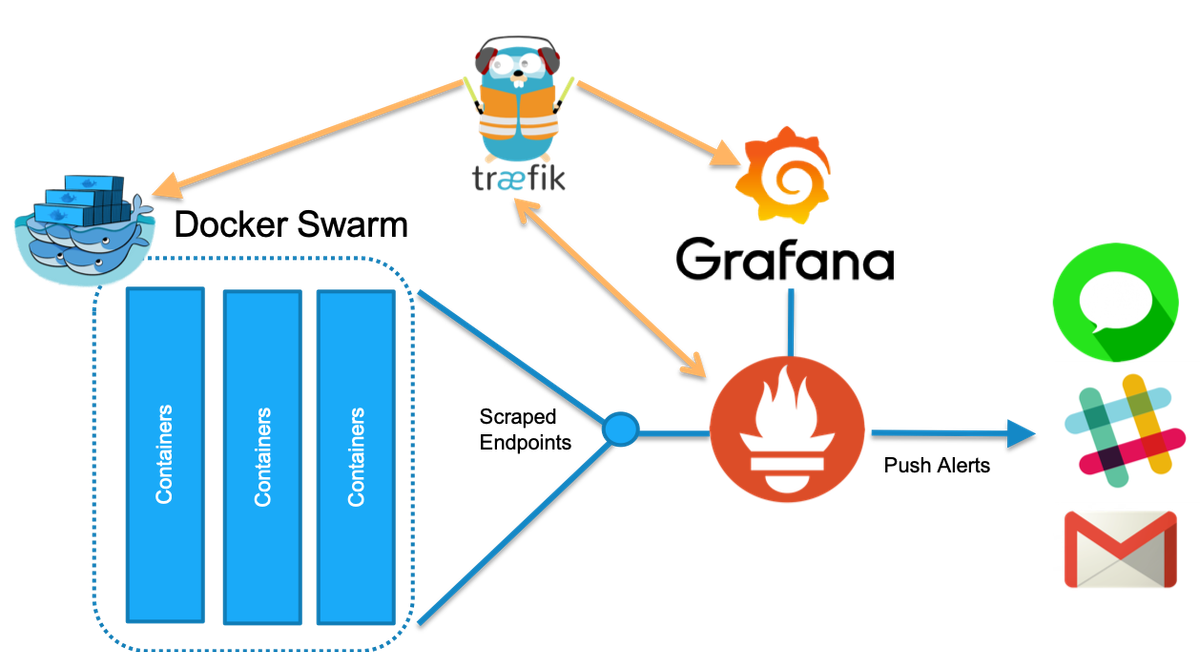
This project helps you start monitoring Traefik and deploying a monitoring stack all in one go. Along with Traefik, the Repo provisions Prometheus for Time Series Data collection and Grafana for Visualizations. Traefik acts as a proxy in front of Prometheus and Grafana, while Prometheus monitors Traefik the other way. Cool, huh?
The deployment includes some auto-provisioning magic that deploys some starter Data sources and Dashboards for Grafana.
If you navigate Grafana Provisioning folder the Data sources and Dashboards configurations.
Enable Metrics in Traefik
To activate metrics inside of Traefik, we need to pass the metrics flag inside the as seen in the docker-compose.yml gist below.
To enable metrics as seen in the line, add the --metrics. Next, we need to tell Traefik what kind of metrics should be enabled. In our case, we want to enable Prometheus metrics and tell Traefik to store the metrics in time series buckets --metrics.prometheus.buckets=0.1,0.3,1.2,5.0
Stay Updated
Get actionable AI & tech insights delivered every Friday. No fluff, just value.
Subscribe to The Weekly Byte →The bucket numbers indicate time slices of 0.1 seconds, 0.3, etc. So if a metric falls into a specific time range, it falls into that specific bucket. The bucket setting is the default setting.
Wrap up and Deploy It
The Repo is a skeleton for configuring metrics and enabling and monitoring Traefik. It is also the source for instructions on how to deploy and configure in more detail and an additional Cats Gif web app example for adding more workloads to Traefik to see how the visualizations update.
Enjoy the project, and be sure to open an issue if you have problems or questions. I try to keep the Repo the source of comments so others can learn as well.
Below are the slides from the Webinar with Traefik and the recorded YouTube session.
FAQ Section: Deploy, Configure, and Monitor Traefik with Prometheus and Grafana
What is Traefik, and why should I use it with Prometheus and Grafana?
Traefik is a dynamic reverse proxy and load balancer designed for microservices and containerized applications. When used with Prometheus and Grafana, you can effectively monitor Traefik’s performance and health. Prometheus collects metrics from Traefik, and Grafana visualizes these metrics, providing real-time insights into traffic patterns, response times, and potential issues, which is crucial for maintaining the reliability and efficiency of your infrastructure.
How do I deploy Traefik with Prometheus and Grafana?
To deploy Traefik with Prometheus and Grafana:
- Deploy Traefik: Set up Traefik as your reverse proxy by configuring the
traefik.tomlortraefik.ymlfile, specifying your entry points, backends, and routing rules. - Enable Prometheus Metrics: In your Traefik configuration file, enable Prometheus by adding the metrics configuration section, which typically includes
metrics.prometheus.entryPointto expose metrics on a specific port. - Deploy Prometheus: Install Prometheus, configure it to scrape metrics from Traefik by adding a scrape job in
prometheus.yml, pointing it to the Traefik metrics endpoint. - Deploy Grafana: Install Grafana and connect it to Prometheus by adding Prometheus as a data source. Import or create dashboards to visualize the metrics collected from Traefik.
This setup enables you to monitor and manage Traefik's performance through detailed, real-time dashboards.
What key metrics should I monitor in Traefik using Prometheus and Grafana?
Key metrics to monitor in Traefik using Prometheus and Grafana include:
traefik_entrypoint_requests_total: Total number of requests received by each entry point.traefik_backend_requests_total: Total number of requests forwarded to each backend service.traefik_backend_request_duration_seconds: Duration of requests processed by backends, indicating response times.traefik_backend_errors_total: Number of errors encountered by each backend service, helping to identify issues.
Monitoring these metrics helps you understand traffic patterns, identify bottlenecks, and ensure that your services are running smoothly.
How do I configure alerts for Traefik using Prometheus and Grafana?
To configure alerts for Traefik using Prometheus and Grafana:
- Set Up Alertmanager: Install Prometheus Alertmanager and configure it in
prometheus.ymlto handle alerts. - Define Alerting Rules: In Prometheus, create alerting rules based on Traefik metrics, such as high response times (
traefik_backend_request_duration_seconds) or excessive errors (traefik_backend_errors_total). - Configure Notifications: In Alertmanager, set up notification channels (e.g., email, Slack) to receive alerts when conditions in your rules are met.
- Visualize Alerts in Grafana: Use Grafana’s alerting feature to create visual alerts on your dashboards, making it easy to see when a metric crosses a critical threshold.
This setup ensures that you are promptly notified of any issues, allowing you to take action before they impact your services.
What are the benefits of monitoring Traefik with Prometheus and Grafana?
Monitoring Traefik with Prometheus and Grafana offers several benefits, including:
- Real-time insights: Get immediate visibility into Traefik’s performance and health, enabling quick responses to issues.
- Customizable dashboards: Grafana allows you to create tailored dashboards that focus on the metrics most important to your infrastructure.
- Proactive alerting: Set up alerts to be notified of potential problems before they escalate, helping to maintain service reliability.
- Scalability: Prometheus and Grafana can scale with your environment, handling large volumes of metrics efficiently.
These benefits help you maintain a robust, high-performance infrastructure by keeping your reverse proxy and services well-monitored.
Follow me
If you liked this article, Follow Me on Twitter to stay updated!