How to Monitor a Traefik Reverse Proxy with Prometheus
Learn how to monitor Traefik reverse proxy with Prometheus. This guide covers setup steps, key metrics to track, and how to visualize Traefik's performance using Prometheus and Grafana for optimized monitoring.

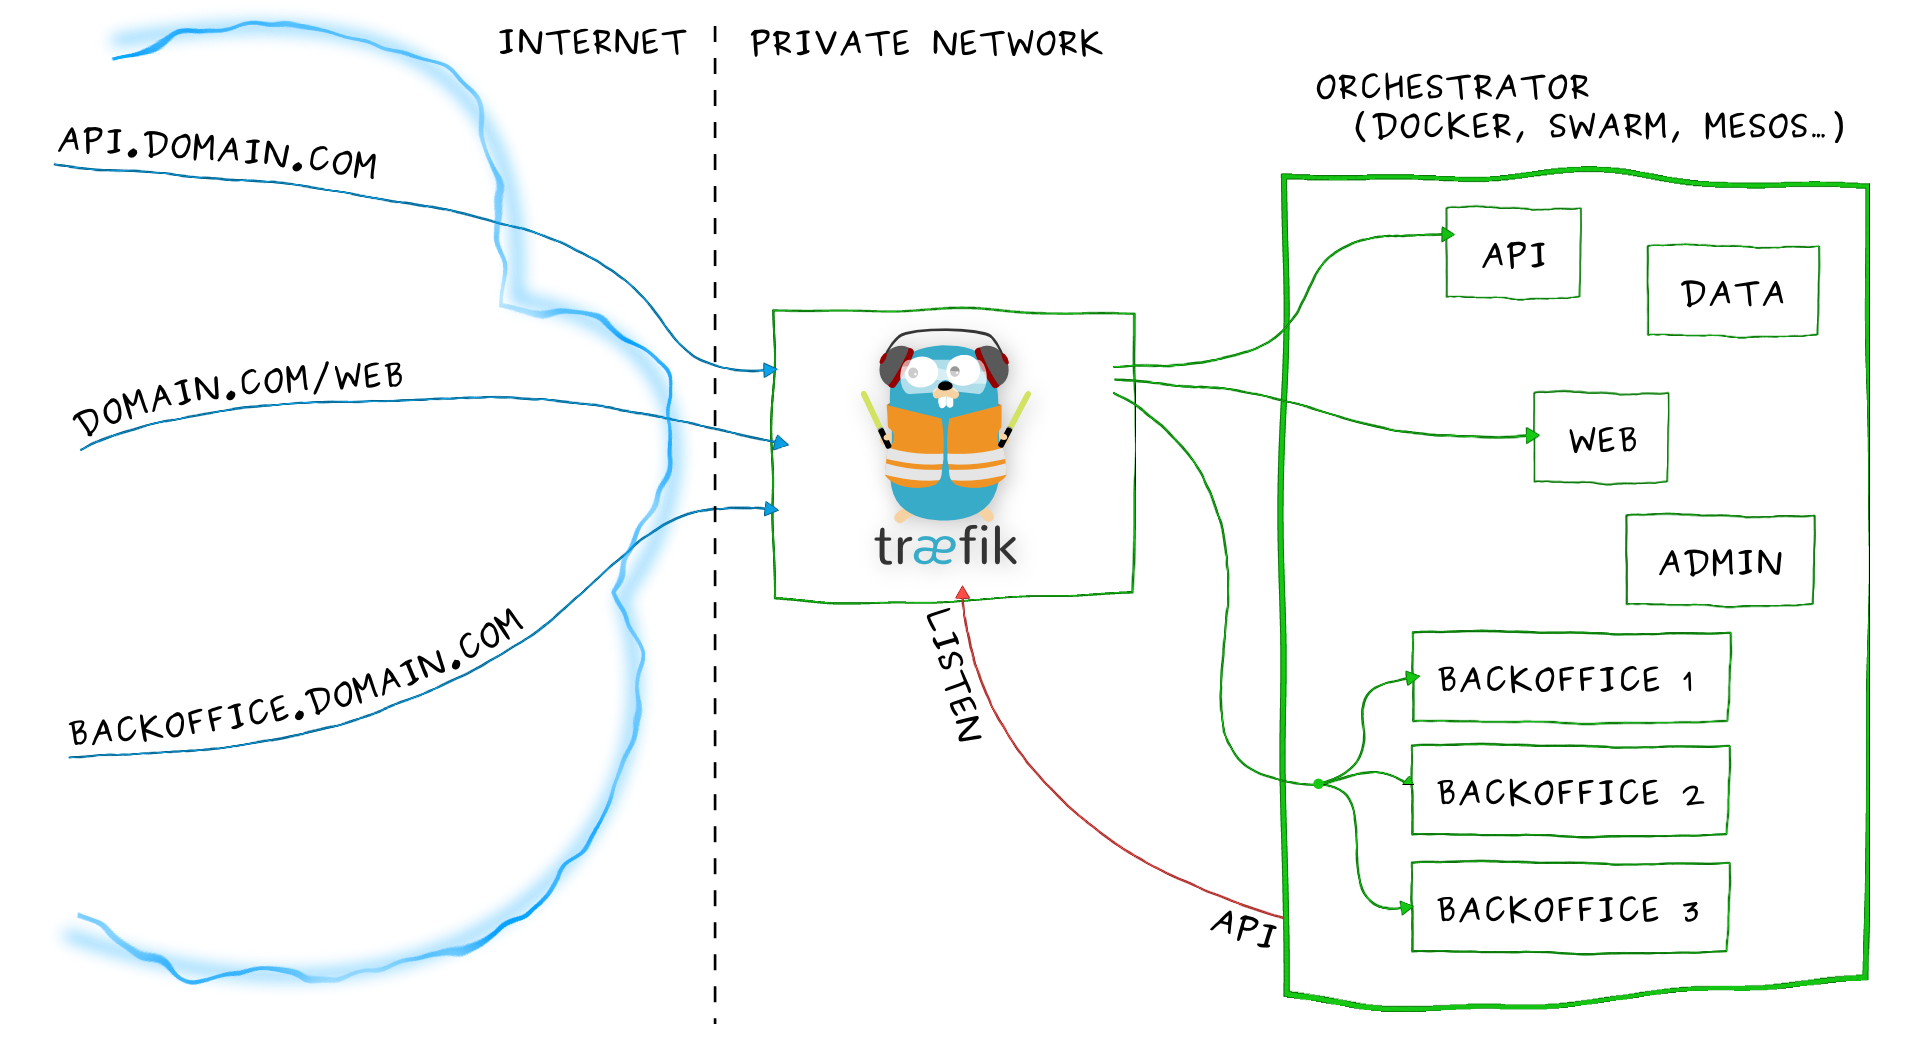
Recently, I started using the reverse proxy Traefik as a default for my projects. Traefik supports Docker Swarm, Kubernetes, and many other orchestrators, but the power is how easy it is to configure and set up.
What's unique about Traefik compared to NGINX or Apache is that it dynamically listens to your Orchestrator like Docker, knows each time a container is added, removed, killed, or upgraded, and can generate its configuration automagically. Really?
Tell me more.
I'm running Docker as an Orchestrator (obviously). Traefik listens to the Docker API for containers starting or stopping on Docker and it dynamically registers this information with Traefik. How cool is that?
Traefik comes out of the box with nice dashboards for your services and the health of these services.
The Traefik dashboards are nice, but I want this information in a central location with the rest of my monitoring information. After quite some digging through Traefik configurations, GitHub issues, and tons of side discussions, I finally found that Traefik exports metrics in a Prometheus-friendly format.
Wow, this is great news.
Deploy Traefik
The time has come to start playing with Docker, my favorite past time. We will launch two separate Docker stacks.
Stack 1 will contain our Prometheus stack for monitoring Traefik.
Stack 2 will be the Traefik stack. This might be new for some as we will join the Traefik container to the Prometheus network. This allows us to have two different docker-compose files yet all containers can interact with each other via Docker networking. Cool, right?
First, we need to clone the Traefik repo.
$ git clone https://github.com/vegasbrianc/docker-traefik-prometheus
Let's quickly look at the docker-compose.yml file to understand how Traefik will communicate with Prometheus. The docker-compose.yml file is very simple in terms of compose files go.
The command key is where both the Docker endpoint and Prometheus metrics are enabled.
At the bottom of the docker-compose file is the networksThe section is at the bottom of the docker-compose file.
Here, we connect to the network of the Prometheus stack. If desired, this connects the Traefik container to the Prometheus network or additional networks.
version: '3'

services:
  traefik:
    image: traefik
    command: --web --web.metrics.prometheus --web.metrics.prometheus.buckets="0.1,0.3,1.2,5.0" --docker --docker.domain=docker.localhost --logLevel=DEBUG
    networks:
      - prometheus
    ports:
      - "80:80"
      - "8080:8080"
    volumes:
      - /var/run/docker.sock:/var/run/docker.sock

networks:
 prometheus:
   external:
     name: dockerprometheus_back-tier
Time to start Traefik
From the Traefik directory, let's start the Traefik stack.
$ docker-compose up -d
Once Traefik is up and running, open a browser tab and open the Trafik Dashboard with http://0.0.0.0:8080Since nothing is running, the dashboard should be blank.
Click on the health tab at the top of the page, which will display some basic health statistics about Traefik.
Deploy Prometheus
Next, we need to deploy a Prometheus stack. Lucky for you I have a Docker stack containing Docker, Prometheus, and Grafana ready for such a task.
Clone the below repository to your Docker host. This repository contains instructions if you have never set this up Prometheus.
$ git clone https://github.com/vegasbrianc/prometheus
Before we can launch the stack we need to adjust the targets which Prometheus will scrape. A target is an endpoint which Prometheus listens to for metrics.
In the Prometheus project directory, edit the following file. prometheus/prometheus.yml.
Navigate to the end of the file and replace localhost with Traefik's metric endpoint traefik:8080
    static_configs:
     - targets ['traefik:8080','cadvisor:8080','node-exporter:9100']
Once we have made this change, we can start the Prometheus stack. From the Prometheus project directory run:
$ docker-compose up -d
Traefiking Magic
Now that both Traefik and Prometheus have been deployed, let's look at what Traefik is doing.
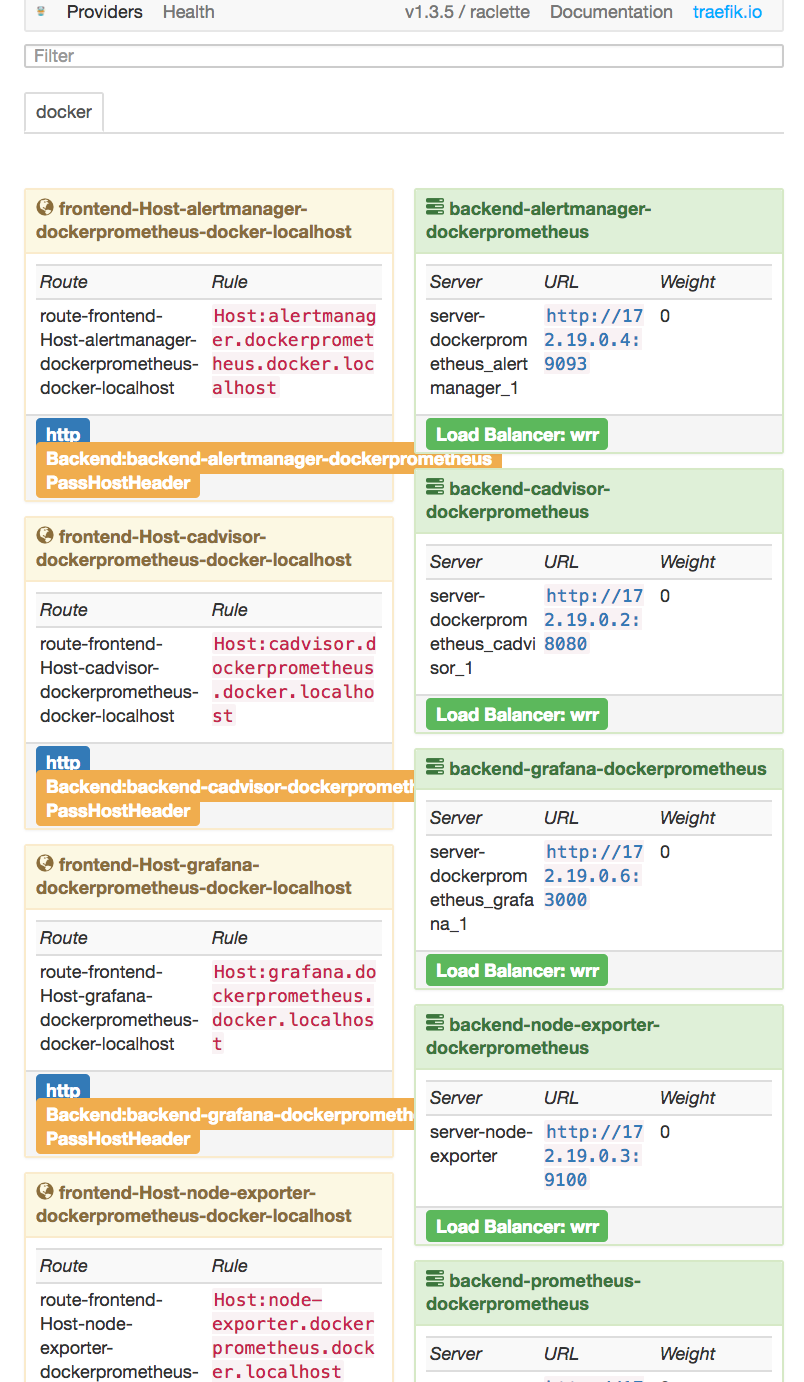
Open up the Traefik dashboard again and have a look http://0.0.0.0:8080. We should now see that Traefik has automatically populated the Providers tab of the dashboard with all the running containers.
Traefik even assigned a local domain name to all of our services 🤯.
We can now choose a hostname from one of our services and access it directly via the hostname. For demo purposes, let's use Grafana, as we know this service is exposed.
In your browser, open http://grafana.dockerprometheus.docker.localhost. This should now open the Grafana login page.
If you have never setup Grafana be sure to check the setup instructions in the Prometheus Repo.
Setup the Traefik Grafana Dashboard
We covered a lot of ground. The following steps will start to show how this all comes together inside Grafana. In the previous section, you configured Grafana and Prometheus as a Data Source.
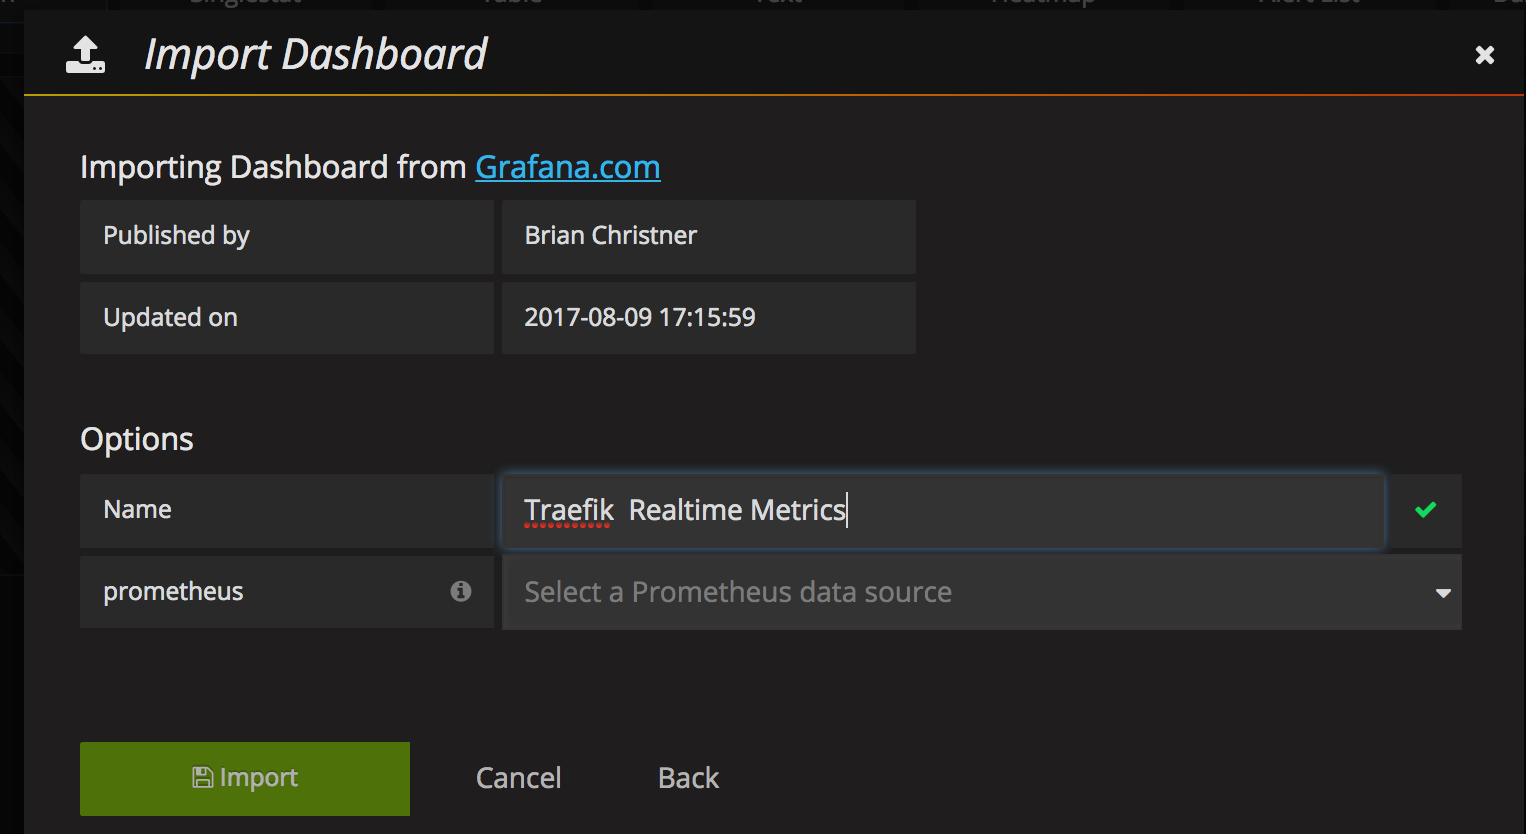
Several starter dashboards are available via Grafana. I took the liberty of combining a couple of dashboards into a new one to offer a little more functionality. Open the Grafana menu -> Dashboards -> Import. You will now be prompted with an import screen.
Enter 2870 for the Dashboard ID to import. This will import the Dashboard directly from Grafana.
Next, select the Data Source for Prometheus, which we created earlier, and click Import.
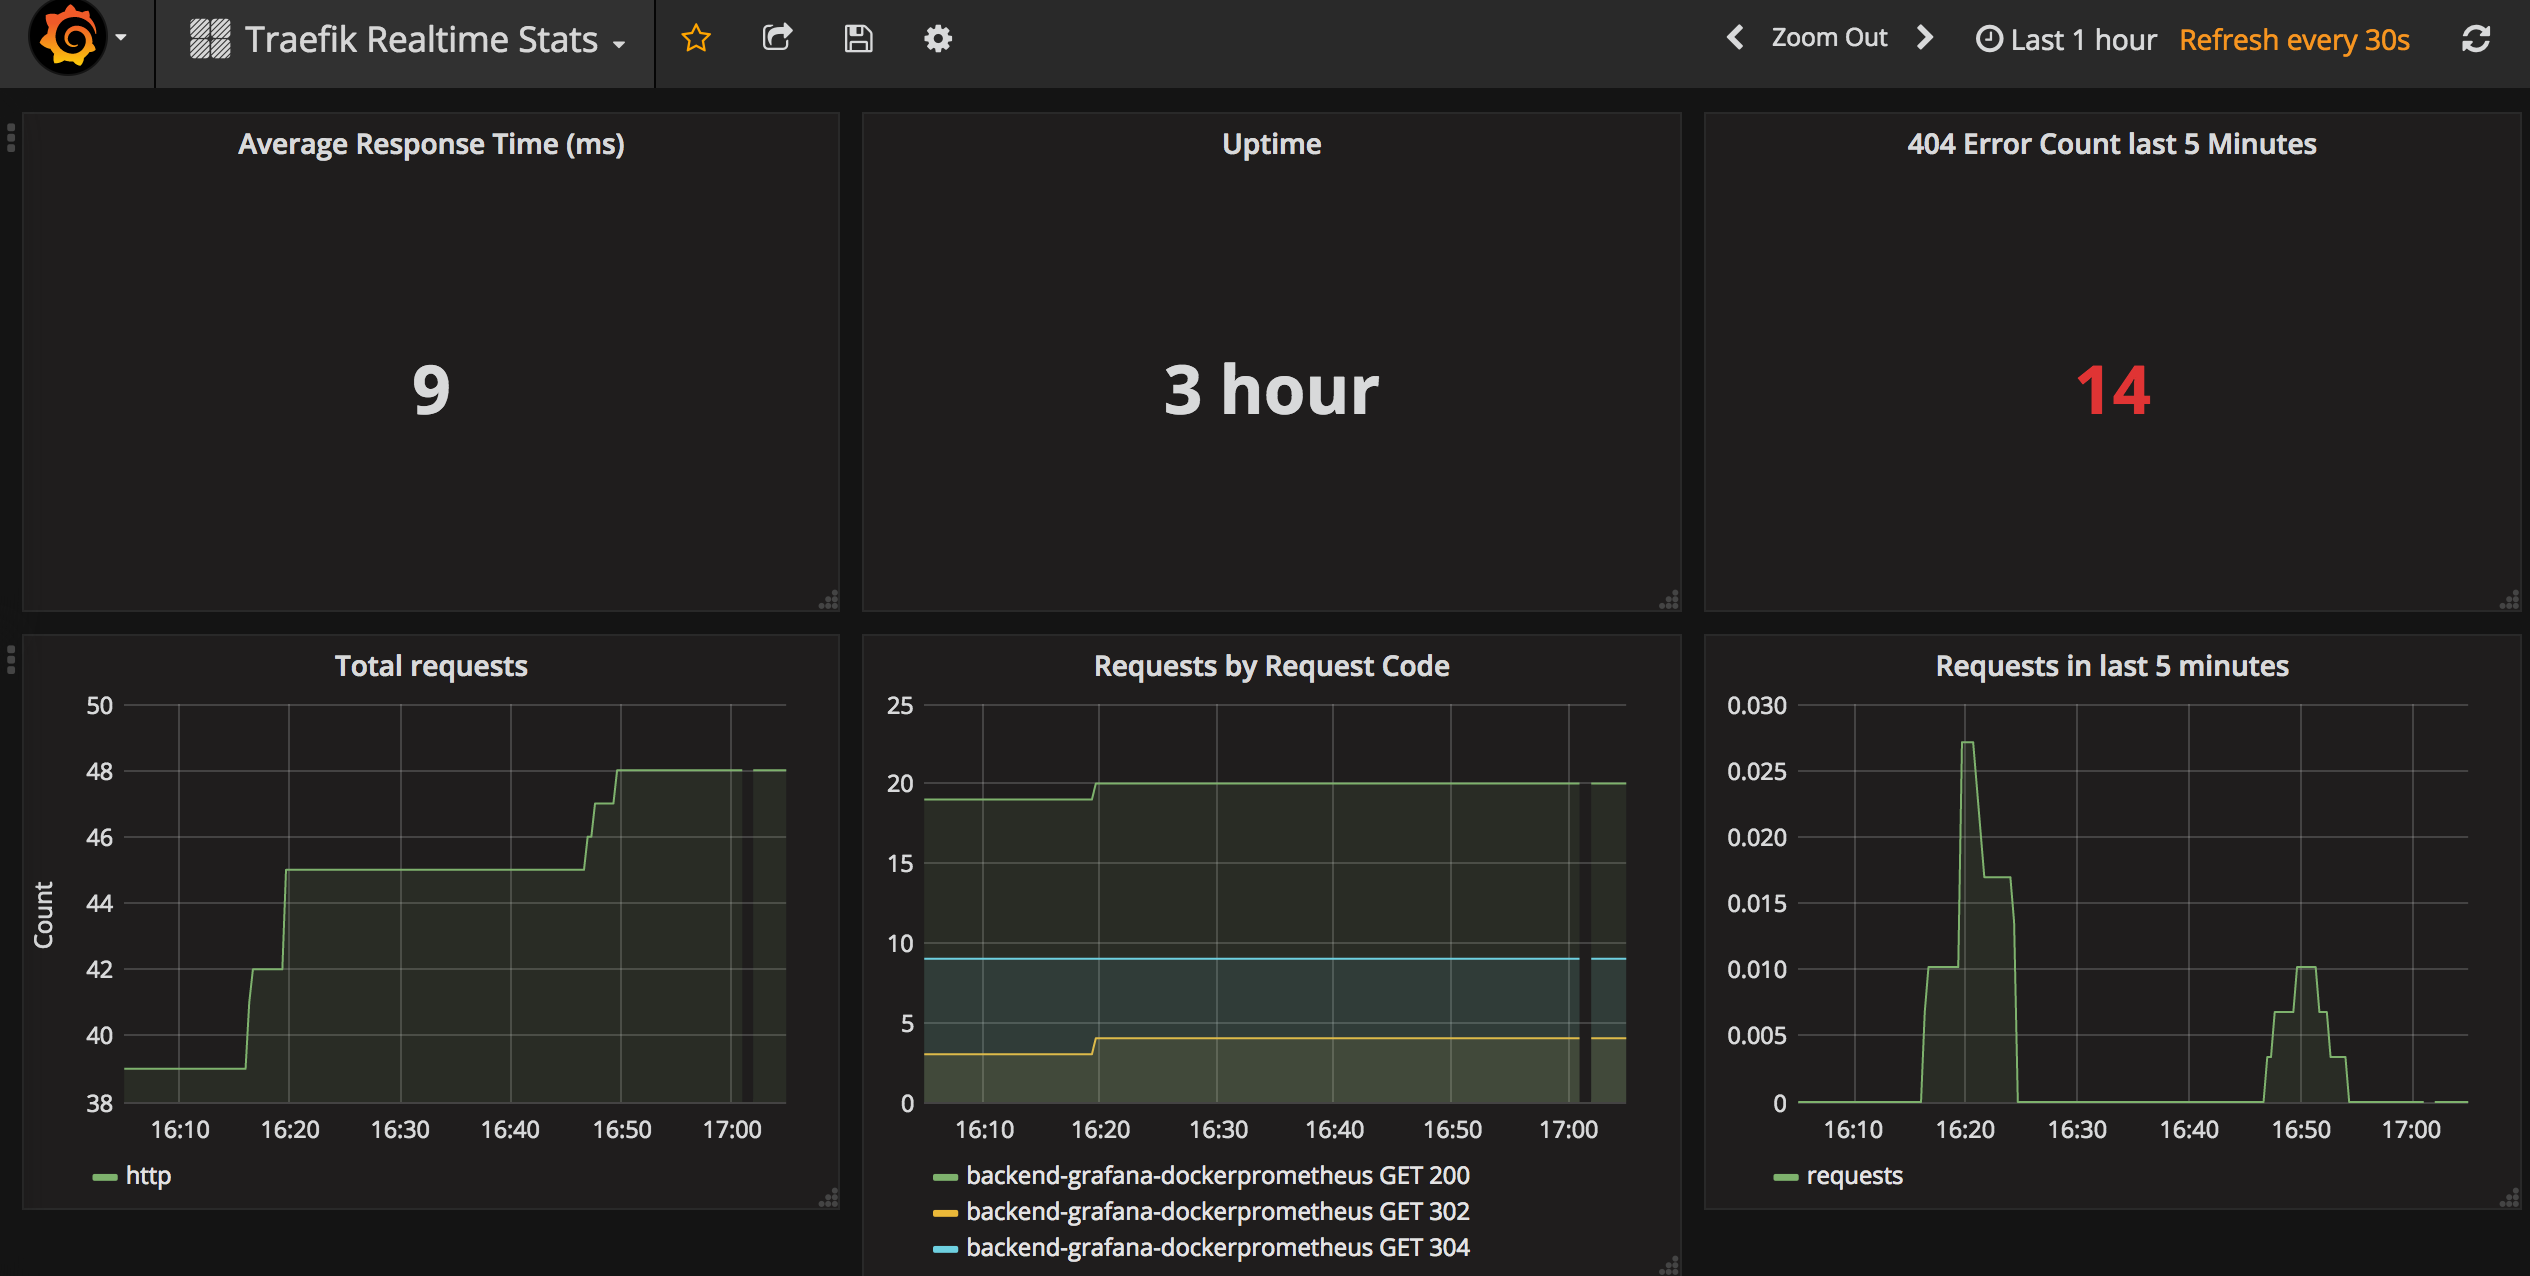
Great! Now you should see the Traefik dashboard inside Grafana. Have a look around, and don't forget to ping me if you have any questions.
FAQ Section: How to Monitor Traefik Reverse Proxy with Prometheus
What is Traefik, and why should I monitor it with Prometheus?
Traefik is a popular reverse proxy and load balancer designed to manage microservices in a dynamic and automated way. Monitoring Traefik with Prometheus is important because it provides real-time insights into Traefik's performance, including metrics like request rates, response times, and error rates. This helps you ensure that your services are running smoothly and allows you to quickly identify and resolve issues.
How do I set up Prometheus to monitor Traefik?
To set up Prometheus for monitoring Traefik, start by enabling Traefik's metrics endpoint in the Traefik configuration file. You'll need to specify Prometheus as the metrics provider. Next, configure Prometheus by adding a scrape job in the prometheus.yml file that points to the Traefik metrics endpoint. Once both are configured, Prometheus will begin collecting and storing Traefik's metrics for analysis and visualization.
What key metrics should I monitor in Traefik using Prometheus?
Key metrics to monitor in Traefik using Prometheus include traefik_entrypoint_requests_total (total number of requests received by entry points), traefik_backend_request_duration_seconds (response time of backend services), and traefik_backend_requests_total (total number of requests forwarded to backend services). Monitoring these metrics helps you assess the performance and reliability of your reverse proxy setup.
How can I visualize Traefik metrics collected by Prometheus?
You can visualize Traefik metrics collected by Prometheus using Grafana, a popular open-source visualization tool. By connecting Grafana to your Prometheus instance, you can create custom dashboards that display Traefik's metrics in real-time. Pre-built Grafana dashboards for Traefik are also available, allowing you to quickly set up comprehensive monitoring views without needing to build them from scratch.
What are the benefits of monitoring Traefik with Prometheus?
Monitoring Traefik with Prometheus offers several benefits, including real-time visibility into the performance of your reverse proxy, early detection of potential issues, and the ability to optimize traffic routing and load balancing. This monitoring setup also helps in ensuring high availability and reliability of your microservices, making it easier to maintain a stable and performant infrastructure.
Follow me
If you liked this article, Follow Me on Twitter to stay updated!