How to setup Prometheus Docker Monitoring

Continuing with the great response from the Docker Monitoring post. I am following up by investigating the setup of Prometheus. I first discovered Prometheus while making changes to the cAdvisor documentation and noticed that cAdvisor now integrates with Prometheus.
So, what is Prometheus? Prometheus was a solution created by SoundCloud (Yes, that SoundCloud). As current Docker monitoring solutions were not scratching their itch, they decided to roll out their solution to suit their needs.
Thankfully, SoundCloud decided to Open Source Prometheus in January 2015 as it is a great product. Look at the SoundCloud blog back in January 2015 for more details about the release.
UPDATE: Tobi from SoundCloud clarified this paragraph. SoundCloud created Prometheus as a general monitoring solution that recently integrated Docker. Also, Prometheus has been open source since the beginning but was only announced at the beginning of this year. Thanks, Tobi!
OK, enough beating around the bush. How the heck can we deploy a Prometheus Docker Monitoring stack? I spent a lot of time fine-tuning the docker-compose file so you can easily stand up a Prometheus stack with all the required components to quickly get up and running.
Pre-requisites
Before installing the Prometheus stack, install docker-compose on your Docker host machine.
Installation & Configuration
Clone the Prometheus Monitoring Project locally to your Docker host.
If you want to change which targets should be monitored or make configuration changes, edit the prometheus.yml file. The targets section. The targets section defines which components (data exporters) Prometheus should monitor. The names defined in this file are sourced from the service name in the docker-compose file. If you wish to change the names of the services, change the "container_name" parameter in the docker-compose.yml file.
Once configurations are done, let's start them up. From the /prometheus project directory, run the following commands:
$ docker-compose up
$ docker-compose start
The Prometheus stack should now be running. To access the different components:
Prometheus: http://<Host IP Address>:9090> for example http://192.168.10.1:9090
Prometheus Dashboard: http://<Host IP Address>:3000 for example http://192.168.10.1:3000
Post Configuration
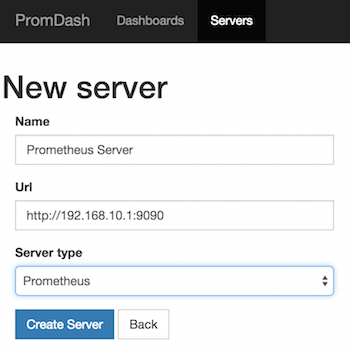
Now, we need to connect the Prometheus Dashboard to the Prometheus installation. Access the Prom Dash as mentioned above.
- Click the "Server" Menu at the top
- Click "New Server"
- Input the desired name, Prometheus server IP and port (
http://<Host IP Address>:9090>) and select Prometheus for server type.
Configure Dashboards
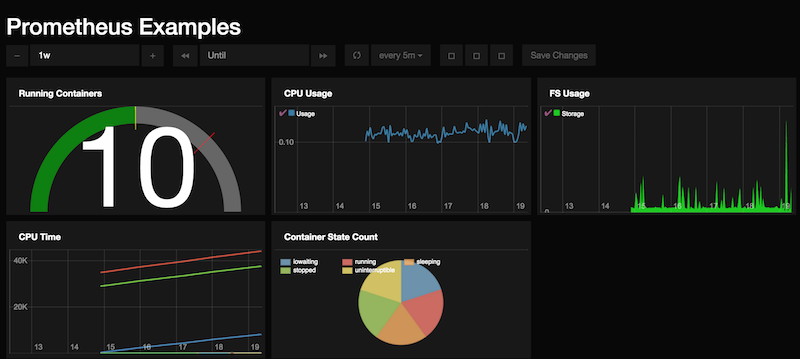
Let's create our first Dashboard. Go to the Dashboard menu. First, create a new directory. Next, create a new Dashboard.
Here's a quick Dashboard I put together as an example.
Sample Dashboard Queries
The queries used in the example dashboard are located in the Dashboards directory
ToDo
- Integrate Alerting with project
- Make a separate stack with just cAdvisor as the metric collection
Follow me
If you liked this article, Follow Me on Twitter to stay updated!