How to monitor Docker for Mac/Windows
Learn how to monitor Docker on Mac and Windows using tools like Docker Dashboard and command-line utilities. Discover best practices for tracking performance metrics, identifying high resource usage, and maintaining a healthy Docker environment.
Monitoring is now baked into Docker for Mac/Windows by default. How cool is that?
We no longer need to guess about the performance of our development machines or test environments.
Some may ask the million-dollar question of why we would want to monitor our local installation.
Well, for starters, I am sort of monitoring mad and monitoring everything. Second, in order to truly understand your environment, we need to dissect what is running and how it's running. Finally, it is good practice to understand your environment and whether it is impacting the performance of your workload.
Monitoring the Docker for Mac/Windows Daemon
Let's get started by configuring your installation. The following screenshots are from a Mac, but the steps should work the same for Windows.
We will now enable Daemon metrics on our Docker for Mac/Windows formatted for Prometheus
- Open Docker for Mac/Windows Preferences menu
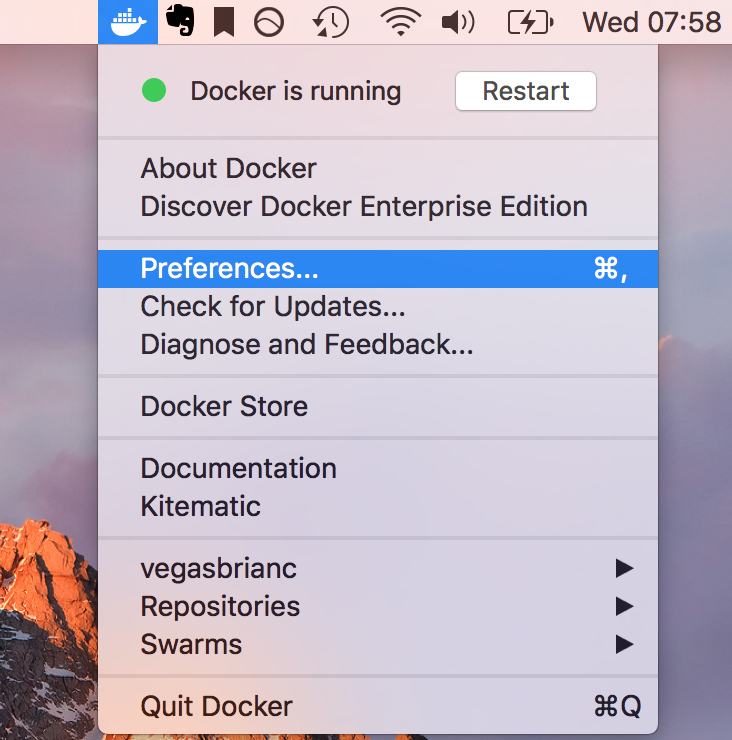
2. Navigate to the Daemon menu and click Advancedcode box
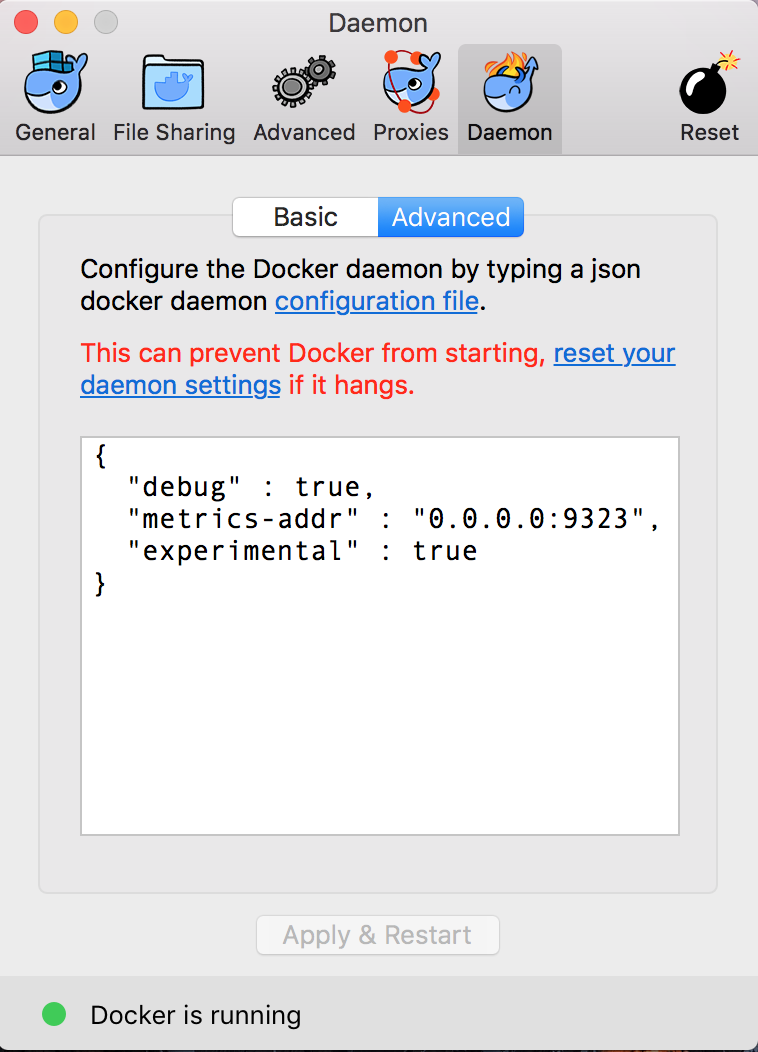
3. Inside the code box, we will add a line to enable the metrics. Add the following line of code below the `debug` statement: metrics-addr" : "0.0.0.0:9323",
Click Apply & Restart and wait for Docker to come back online. 5. Test it out. Open a browser tab with the following URL: http://127.0.0.1:9323/metricsa
Monitor with Prometheus
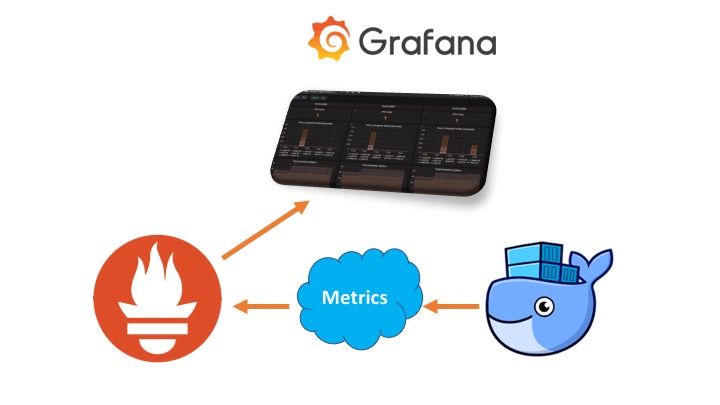
Our local Docker for Mac/Windows installation is now creating Prometheus formatted metrics. Next, let's start up a Prometheus stack and consume these newly created metrics.
- Clone the Prometheus stack locally:
git clone https://github.com/vegasbrianc/prometheus.git . - Edit the
prometheus/prometheus.ymlfile. Navigate to the end of the file and find the section name.static_configs - Edit the target string with the hostname or IP of the machine running Docker for Mac/Windows:
- targets: ['hostname-here:9323'] - Save the file and exit
- Start the Prometheus stack:
docker-compose up -d
Configure Grafana
- In a new browser tab, Open Grafana:
http://0.0.0.0:3000 - Login to Grafana: username -
adminpassword -foobar - After logging in,
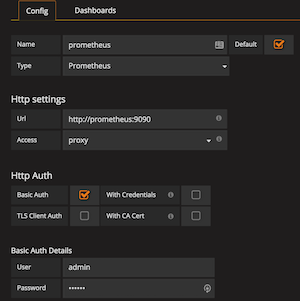
to add a data source with a green buttonyou will be prompted with a green button to add a data source. ClickAdd Data Source - Input the following information into the Data Source:
Name:Prometheus
Type:Prometheus
URL:http://prometheus:9090
Access: Leave theUserdefault
HTTP Auth: ClickBasic Auth
User:admin
Password:foobar - Click on the Grafana Logo in the upper right-hand corner, hover over Dashboards, and select
import - Type the number
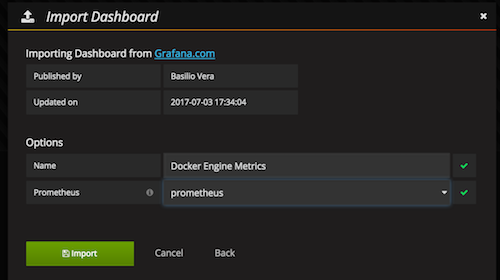
1229in the Grafana.com Dashboard input area, clickLoad
Everything should now be populated except for the last field that requires the data source. Click the drop-down and select prometheus and click Import
Click Save & Test
Conclusion
We have set up the Docker Daemon to log its metrics, configured and launched a Prometheus stack to consume these metrics, and finally imported a Grafana dashboard as a starting point. Based on this installation you should now be able to create some interesting graphs and dashboards.
Happy monitoring!
FAQ Section: How to Monitor Docker for Mac and Windows
Why is it important to monitor Docker on Mac and Windows?
Monitoring Docker on Mac and Windows is crucial for ensuring that your containers run efficiently and that system resources are used optimally. By keeping an eye on performance metrics like CPU, memory, and disk usage, you can identify potential issues before they impact your applications. Monitoring helps you maintain the health of your Docker environment and troubleshoot problems more effectively.
What tools can I use to monitor Docker on Mac and Windows?
You can use several tools to monitor Docker on Mac and Windows, including built-in Docker features like Docker Dashboard, which provides a graphical overview of container status and resource usage. Third-party tools like Datadog, Prometheus, and cAdvisor offer more advanced monitoring capabilities, including real-time alerts, detailed metrics, and historical data analysis. These tools help you gain deeper insights into your Docker environment.
How do I set up Docker Dashboard for monitoring on Mac and Windows?
Docker Dashboard is automatically included with Docker Desktop on both Mac and Windows. To access it, simply open Docker Desktop and click on the Dashboard icon. The Dashboard provides an overview of running containers, their resource usage, and any logs or events. It’s a straightforward tool for basic monitoring and managing your containers directly from your desktop.
Can I monitor Docker performance metrics using command-line tools?
Yes, you can monitor Docker performance metrics using command-line tools like docker stats and docker inspect. The docker stats command provides real-time metrics for CPU, memory, network, and disk usage for running containers. docker inspect gives detailed information about a specific container, including its configuration and state. These tools are useful for quick checks and integrating with scripts or automation workflows.
What should I do if I notice high resource usage in Docker on Mac or Windows?
If you notice high resource usage in Docker on Mac or Windows, start by identifying the containers consuming the most resources using tools like Docker Dashboard or docker stats. You can then optimize your containers by adjusting resource limits, optimizing your Dockerfile, or scaling down unnecessary services. In some cases, upgrading your system’s hardware or adjusting Docker Desktop’s resource allocation settings can also help improve performance.
Follow me
If you liked this article, Follow Me on Twitter to stay updated!