Docker Prometheus Project Road to 1,000 Stars
The road to 1,000 GitHub stars for the Docker Prometheus project, learnings, and what's next. The project is being used around the world and continues to be updated and used.

Recently, the Docker Prometheus GitHub repo crossed the 1,000-star threshold. Seeing the project grow from a personal playground to become a reference point for monitoring with Prometheus.
Not only is it fun to maintain but it also encourages me to stay updated with the latest Prometheus and Grafana features consistently
How did we get here? The first commit, on August 18, 2015, marked the beginning of Docker Prometheus. It has gone through several transformations since and has added an awesome contributor Paul aka llitfkitfk. We continue to fix bugs, add features, and adapt to new versions of Prometheus, Grafana, and other related tools.
Road to 1,000 Stars
The growth of the project has been steady from the beginning. What I find incredible is the usage of the project rather than the stars. A star, in my opinion, is much like a bookmark where you want to track and follow something.
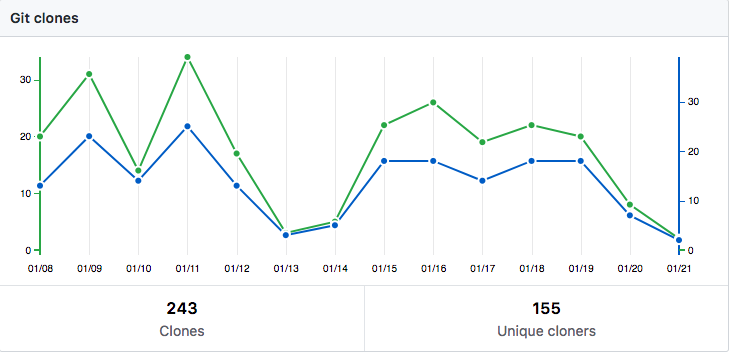
Clones, on the other hand, refer to instances where people are using or trying out the project. The project is averaging about 20 clones Monday to Friday, and weekend traffic drops significantly, which also matches the brianchristner.io website traffic trends as well.
Most common questions/issues
The issues that I receive via GitHub, email, or other channels seem to revolve around visualizing the data in Grafana. It is not necessarily something broken, but rather questions on how to extract specific data and visualize it properly.
However, since Grafana 2.0, I have seen a reduction in such queries, which I attribute to Grafana making everything easier.
We have encountered issues with specific components not working across all platforms. Still, generally, we have stabilized and have been focusing more on features like the Try in PWD button, which we added. It seems to be quite popular to test drive the stack quickly.
Who's using the stack?
Unfortunately, I am not getting much feedback here, but I do know it is in use in companies such as Siemens, Swisscom, Blockchain startups, and my newly founded startup, which is offering this stack as a service to our customers.
Some of the different projects I have created based on the stack include
- Docker Pulls - Visualize Docker-Hub pull statistics with Prometheus
- GitHub Monitoring - Monitor your GitHub projects with Prometheus
- Traefik Reverse Proxy/Load Balancer Monitoring - Monitor the popular Reverse Proxy/Load Balancer Traefik with Prometheus
Are you using the Docker Prometheus stack for your project? Please get in touch and tell us your use case.
What's Next?
We have been asked several times if we would turn this into a service. I don't believe making this stack a SaaS solution would add much benefit. The stack is incredibly easy to use and deploy, and Prometheus and Grafana have matured significantly since their inception.
However, we do see a lot of interest in integrating the stack with various use cases, from Blockchain to IoT. We look to expand the stack into more customized solutions, which we hope to share with you in the next couple of months.
In the short term, expect some new and improved dashboards to emerge that leverage the new Grafana 2.0 features, including annotations, alerting, and templating. Expect more great things!
Thank you to all of you!
This project would have never gotten this far without me alone. The community, the issues, PRs, emails, and tweets have driven me to push this project forward.
Building this project has been an absolute joy, and I look forward to adding even more features.

Follow me
If you liked this article, Follow Me on Twitter to stay updated!