Why Is My Website So Slow? Fix It Fast with Google PageSpeed and CrUX
Discover why your website is slow and how to fix it fast using free Google tools like PageSpeed Insights and CrUX. Boost performance, improve UX, and reduce bounce rates with actionable tips.
Ever opened a website and it paints each image like you are on a dial connection or you have a loading spinner which takes longer to complete than a Microsoft Update.
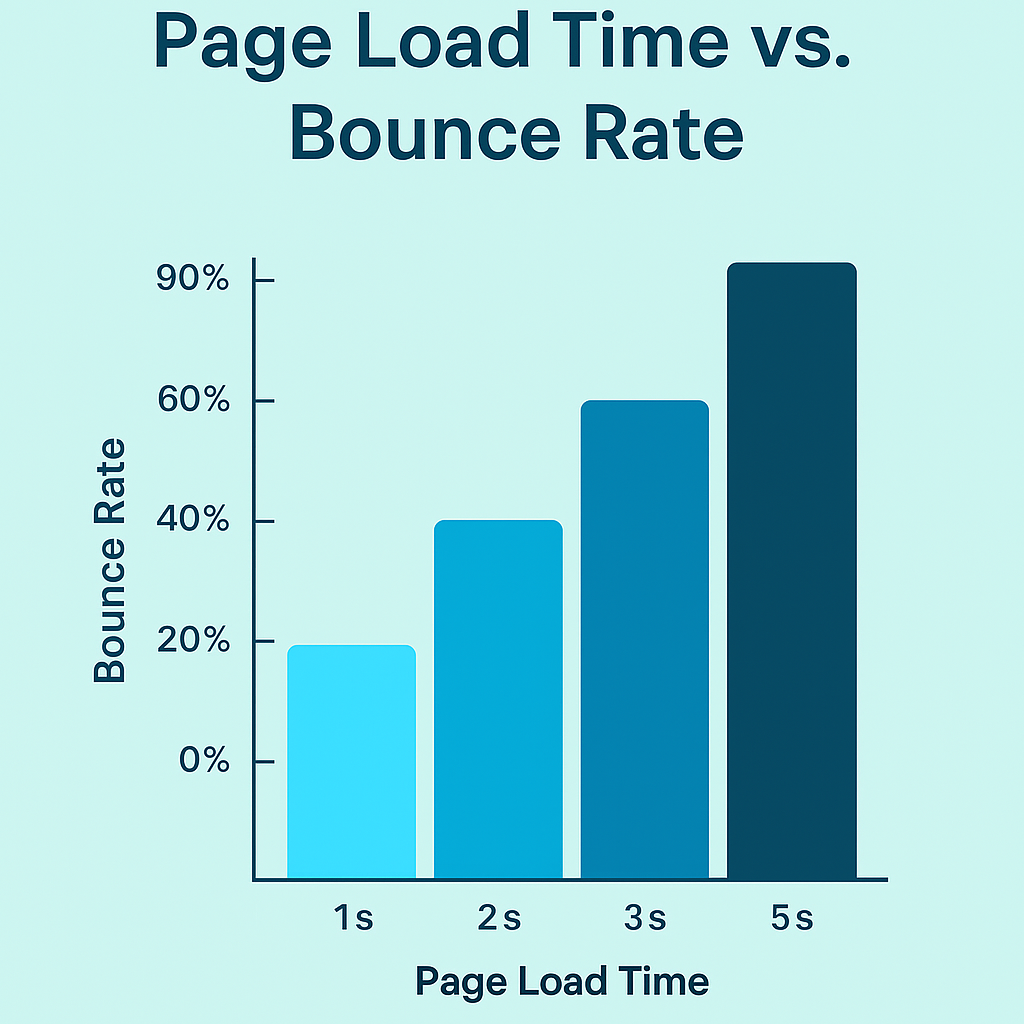
You’re not alone. Website speed isn’t just a nice-to-have — it’s a critical piece of your user experience, SEO, and bottom line. A slow site means frustrated users, higher bounce rates, and fewer conversions. It's proven by Google Bounce Rate Datasets and industry studies that each second of page load time drastically increases the Bounce Rate of website visitors.
But here’s the good news: you don’t need a team of performance engineers to figure it out. Google offers new and powerful (and free) tools that give you deep insight into real performance issues — and more importantly, what to do about them.
I'm personally obsessed with making websites fast and always looking for ways to make them faster. I have a portfolio of websites from WordPress, Vibe Coded AI websites, to a few different blogs. All of them have been put through the wringer on how to squeeze out every ounce of speed to get them to load faster.
In this guide, I’ll walk you through:
- The most common reasons your site is slow
- The exact tools I use to diagnose speed issues
- How to go from “this is slow” to “this is flying”
Let’s get into it.
Common Culprits Slowing Down Your Website
Before we look at the tools, it helps to understand what typically causes slowdowns. These are the usual suspects:
- Massive images or videos loading above the fold
- Third-party scripts doing who-knows-what in the background (many times I've found unused scripts or scripts not even working slowing everything down)
- Bloated CSS and unused JavaScript
- Slow server response time or no CDN
- Lack of caching
- Everything loading all at once (instead of lazily)
Sound familiar? Good — now let’s see how to pinpoint exactly what’s going wrong.
Step 1: Start with Real-World Data Using CrUX
📍 Tool: Chrome UX Report (CrUX) via Looker Studio
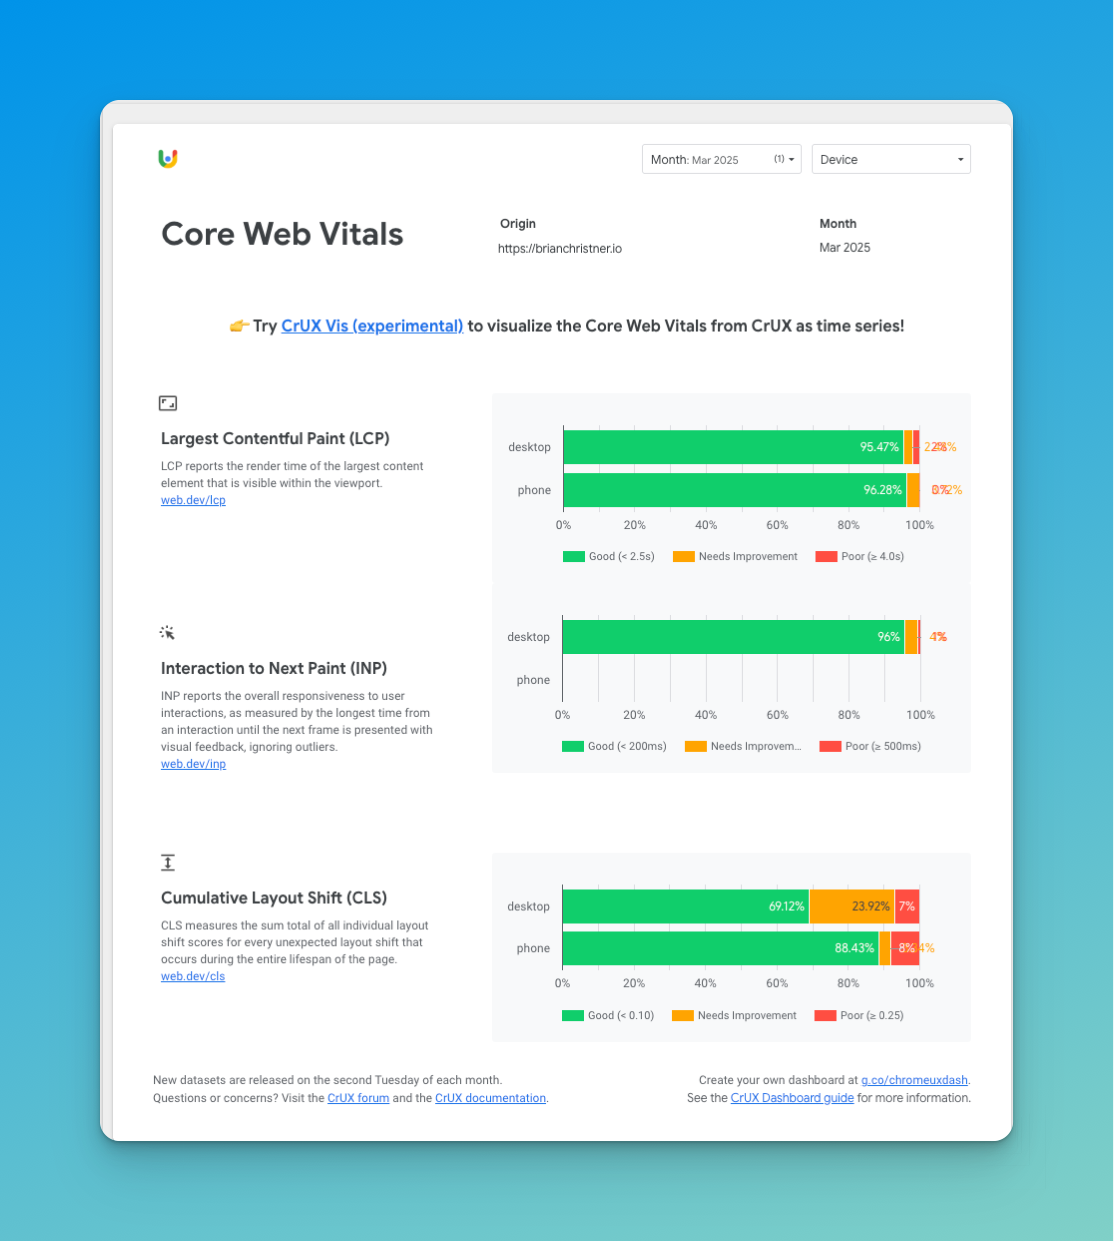
CrUX (also known as the Chrome UX Report, or CrUX for short) is a brand new tool from Google integrating with Looker Studio and Big Query and stores data for up to one year. The CrUX gives you a report card based on real user data. This is key. Most speed tests simulate a load — CrUX shows what actual humans are experiencing across devices, browsers, and network conditions allowing you to easily filter based on your criterias.
What You’ll Learn:
- Core Web Vitals (LCP, INP, CLS)
- How performance varies by country and device
- Where the bottlenecks are
How to Use It:
- Head over to the CrUX dashboard link.
- Plug in your domain.
- Instantly get a Looker Studio dashboard you can share with your team or clients.
It's also great to see the history for each report. For example, here's the FCP (First Content Paint) history for the last 10 months. It helps visualize when you possibly made changes on the website on the impact over time.
Stay Updated
Get actionable AI & tech insights delivered every Friday. No fluff, just value.
Subscribe to The Weekly Byte →Step 2: Use CrUX.Visualizer for a Fast Snapshot of Performance Trends
📍 Tool: CrUX Vis
CrUX Vis is a lightweight visualization tool allowing you to easily see trends overtime. If Looker Studio feels like overkill, the CrUX Vis is a lighter, faster option. Just drop in your domain and it visualizes Core Web Vitals with no setup.
Perfect for:
- Quick visual check-ins
- Spotting regional performance issues
- Skipping the dashboard build-out
Step 3: Run a Deep Dive with PageSpeed Insights
📍 Tool: PageSpeed Insights
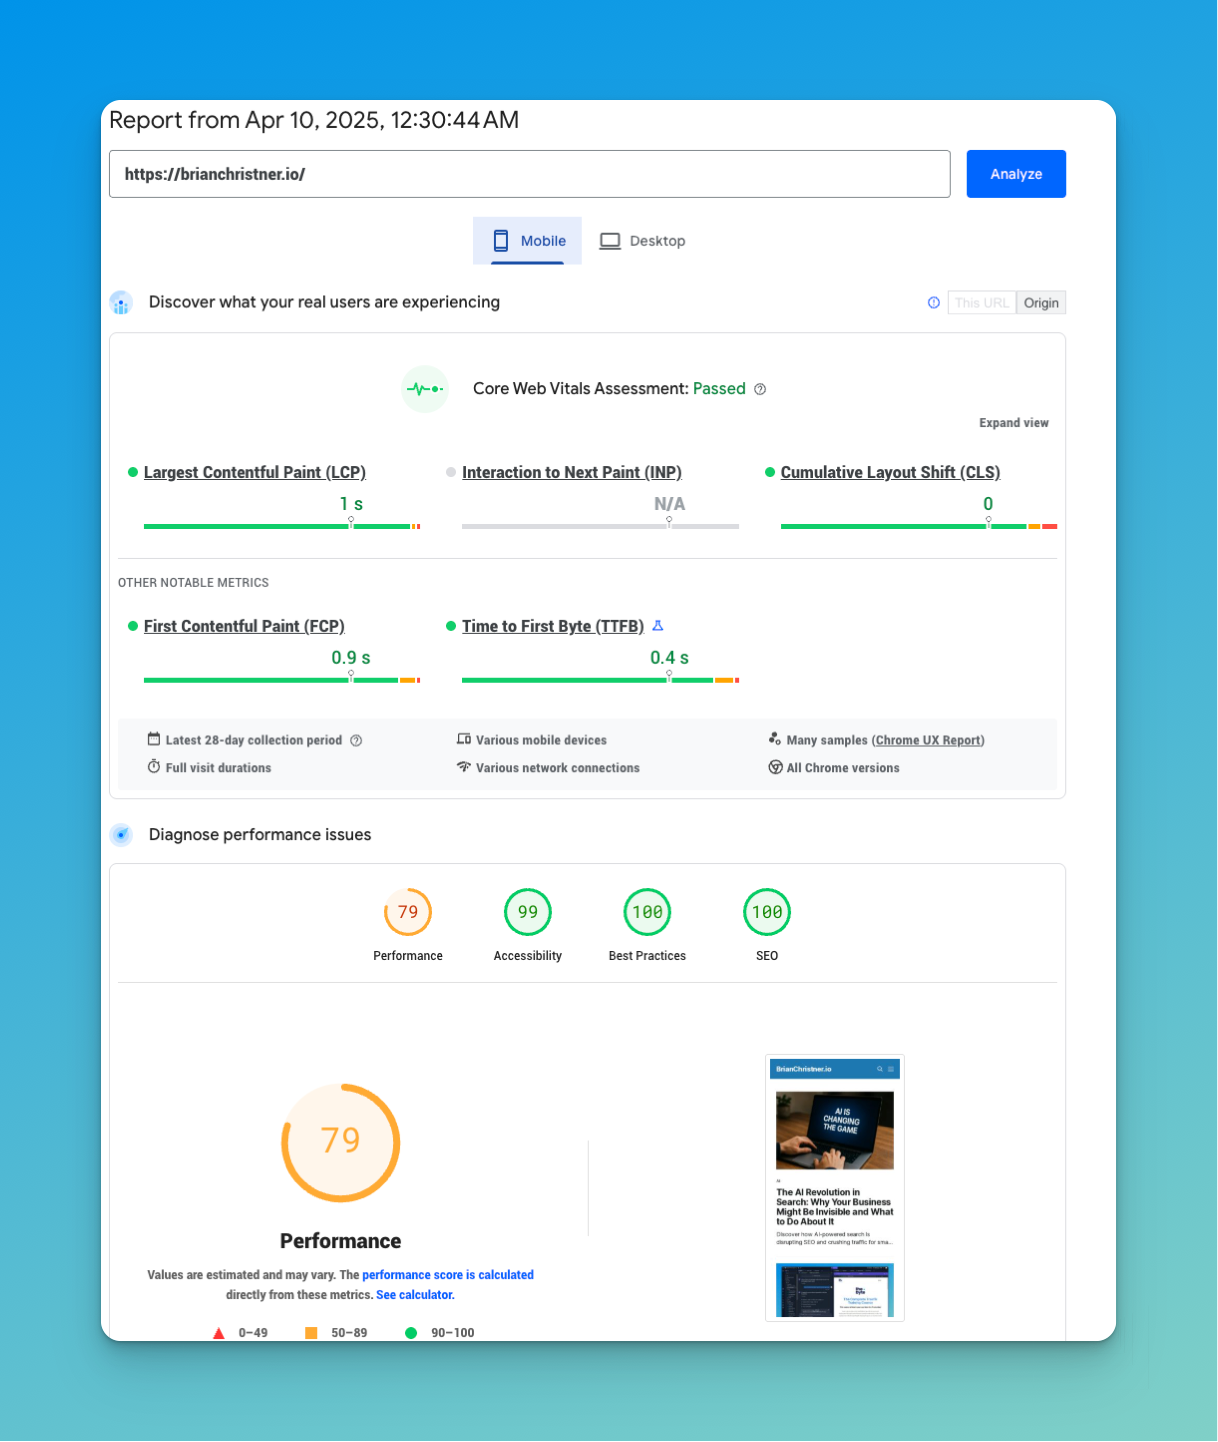
I spend most my time troubleshooting performance issues with PageSpeed Insights. Now that you have field data, it’s time to look under the hood with lab testing. PageSpeed Insights combines CrUX with Lighthouse to show both real-world and simulated performance.
What's great about PageSpeed insights is the breakdown of the exactly the "What" os causing the issues for each Core Web Vital. This is extremly helpful to narrow down your search.
What You’ll See:
- Performance score (0–100)
- Opportunities and diagnostics
- What’s slowing down your site (like render-blocking resources or unused JS)
Why It’s Awesome:
- Each issue comes with a “how to fix” recommendation.
- You’ll see the exact assets hurting your performance.
- You get both mobile and desktop performance snapshots.
👉 Pro Tip: Ensure you type in the domain with the prefix www or non www as this will impact the test. Whatever your default home page is you should use this as your testing page.
Quick Wins: What to Actually Fix
Once you’ve run the tests, you’ll likely see a few recurring themes. Here’s where to start:
🖼️ Compress & Convert Your Images
- Use next-gen formats like WebP.
- Resize images based on device/resolution.
- Tools I like: TinyPNG, Squoosh
- If you use CloudFlare this an option within your account
🧹 Remove Unused CSS & JS
- Clean out code that never gets used.
- Bundle and minify assets for faster loads.
💤 Lazy Load Everything
- Only load images/videos as they scroll into view.
- Bonus: Native lazy loading is supported with
loading="lazy".
🔌 Tame Your Third-Party Scripts
- Audit embedded tools, ads, and trackers.
- Load asynchronously or defer where possible.
🌐 Add a CDN + Caching
- Deliver static assets via a CDN (like Cloudflare or Bunny.net). I'm a huge fan of Cloudflare for both CDN and security
- Set smart caching headers for repeat visits.
Before Getting Started
I highly recommend documenting everything! Believe me from my experience you change a bunch of things at once and all of sudden the performance get a lot better or worse and you don't really know why.
Just start a word document with time and date of a single change. Perform a PageSpeed Insights test and check to see if the performance improved or not. Keep repeating this processes and make sure to validate all the changes.
You process should be:
Bonus: Make Speed a Habit, Not a One-Off
Performance isn’t a set-it-and-forget-it task. Monitor it over time:
- Set up a weekly PageSpeed check
- Track Core Web Vitals in Looker Studio
- Add performance budgets to your CI pipeline (e.g. Lighthouse CI)
Final Thoughts: Fast Websites Win
A fast website doesn’t just feel good — it builds trust, drives conversions, and helps your SEO. And thanks to these Google tools, there’s no excuse for flying blind.
Start with CrUX, visualize the data, run a PageSpeed test, and take action. Even a few small tweaks can shave off precious seconds.
And if you’re stuck at the “okay, now what?” stage — feel free to reach out or drop your PageSpeed score in the comments. I’ve broken enough websites to know how to fix them again.
Ready to find out what’s slowing you down?
👉 Head to PageSpeed Insights and give your site a proper test drive.
Follow me
If you liked this article, Follow Me on Twitter to stay updated!