Monitor your GitHub Repos with Docker and Prometheus

GitHub is full of great code, information, and interesting statistics. GitHub repositories are full of statistics that make perfect candidates to graph with Grafana.
, which produces
Prometheus contains an impressive list of Exporters. These Exporters range from APIs to IoT. They can also integrate with Prometheus and Grafana, which produce beautiful graphs.
Docker, Prometheus, and Grafana
My base setup for anything monitoring-related is the Docker, Prometheus, and Grafana stack. This is the baseline I work from and add components like Exporters. I have created the GitHub-Monitoring Repo from the previous Docker Monitoring article. This contains a Docker compose file which makes this stack simplified and easy to start.
Getting Started
Prerequisite: ensure you have a Docker host running the latest versions of the Docker engine and compose.
If you are running Docker for Mac/Windows, you are already set. Next, clone the GitHub-Monitoring project to your Docker machine.
We can start configuring the project based on your requirements. If you need to track additional Exporters or targets, then edit the Prometheus Targets section located in the static configs section at the end of the file. The Exporter uses the name metrics with port 9171.
    static_configs:
     - targets: ['node exporter:9100','localhost:9090', 'metrics:9171']
Configuration
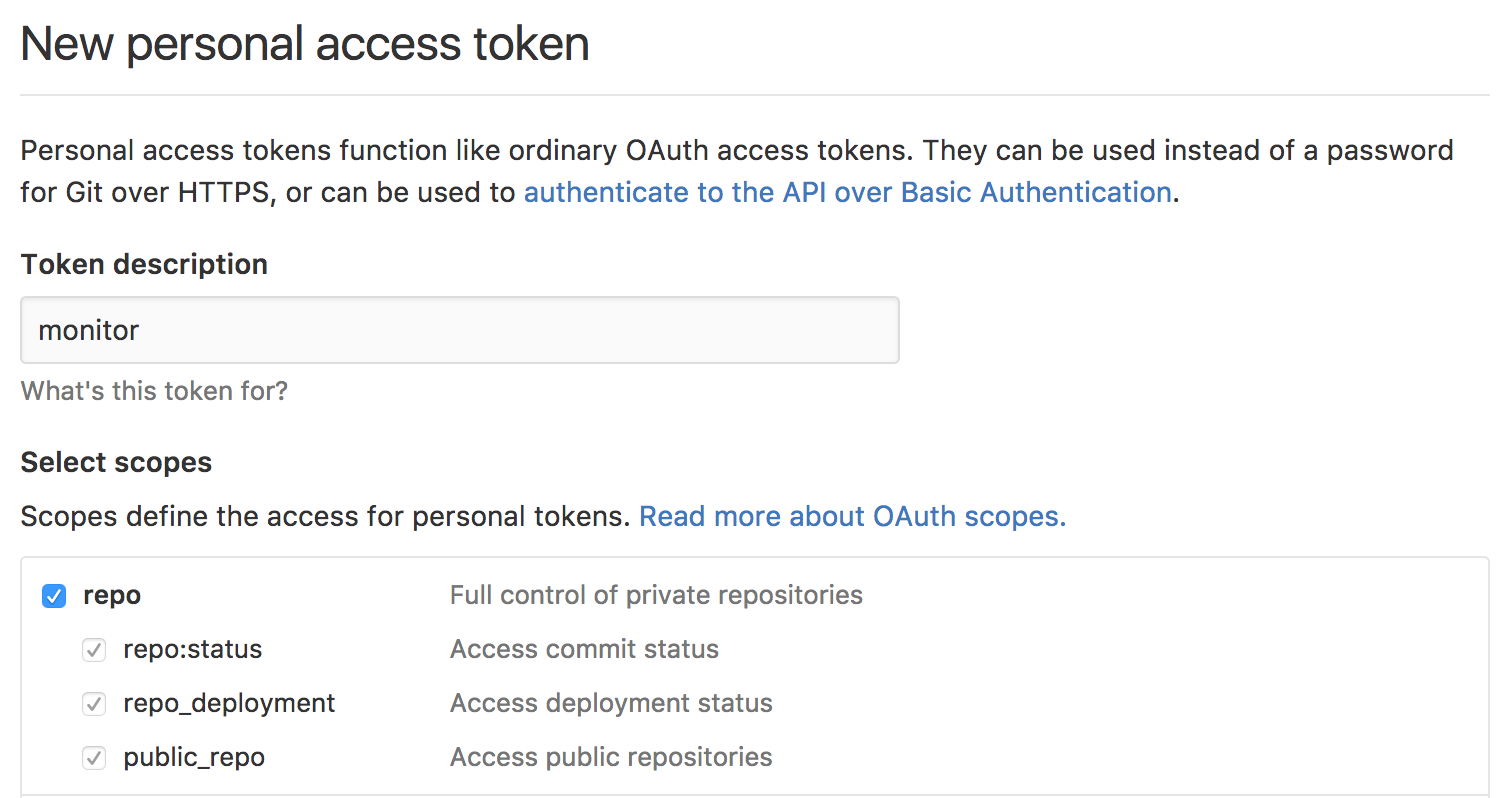
Create a GitHub token for this project. This will prevent us from hitting GitHub's API limits for non-authenticated traffic.
Navigate to Create GitHub Token where we will create a token for this project.
- Provide the token with a description.
- Select scopes: our project only requires the
repopermissions. - Click the generate token button.
- Copy the token ID and store it in a safe place. This is the equivalent of a password, so don't store it in a public place.
Edit the docker-compose.yml file with your favorite editor. Scroll to the end of the file where you will find the metricsservice section.
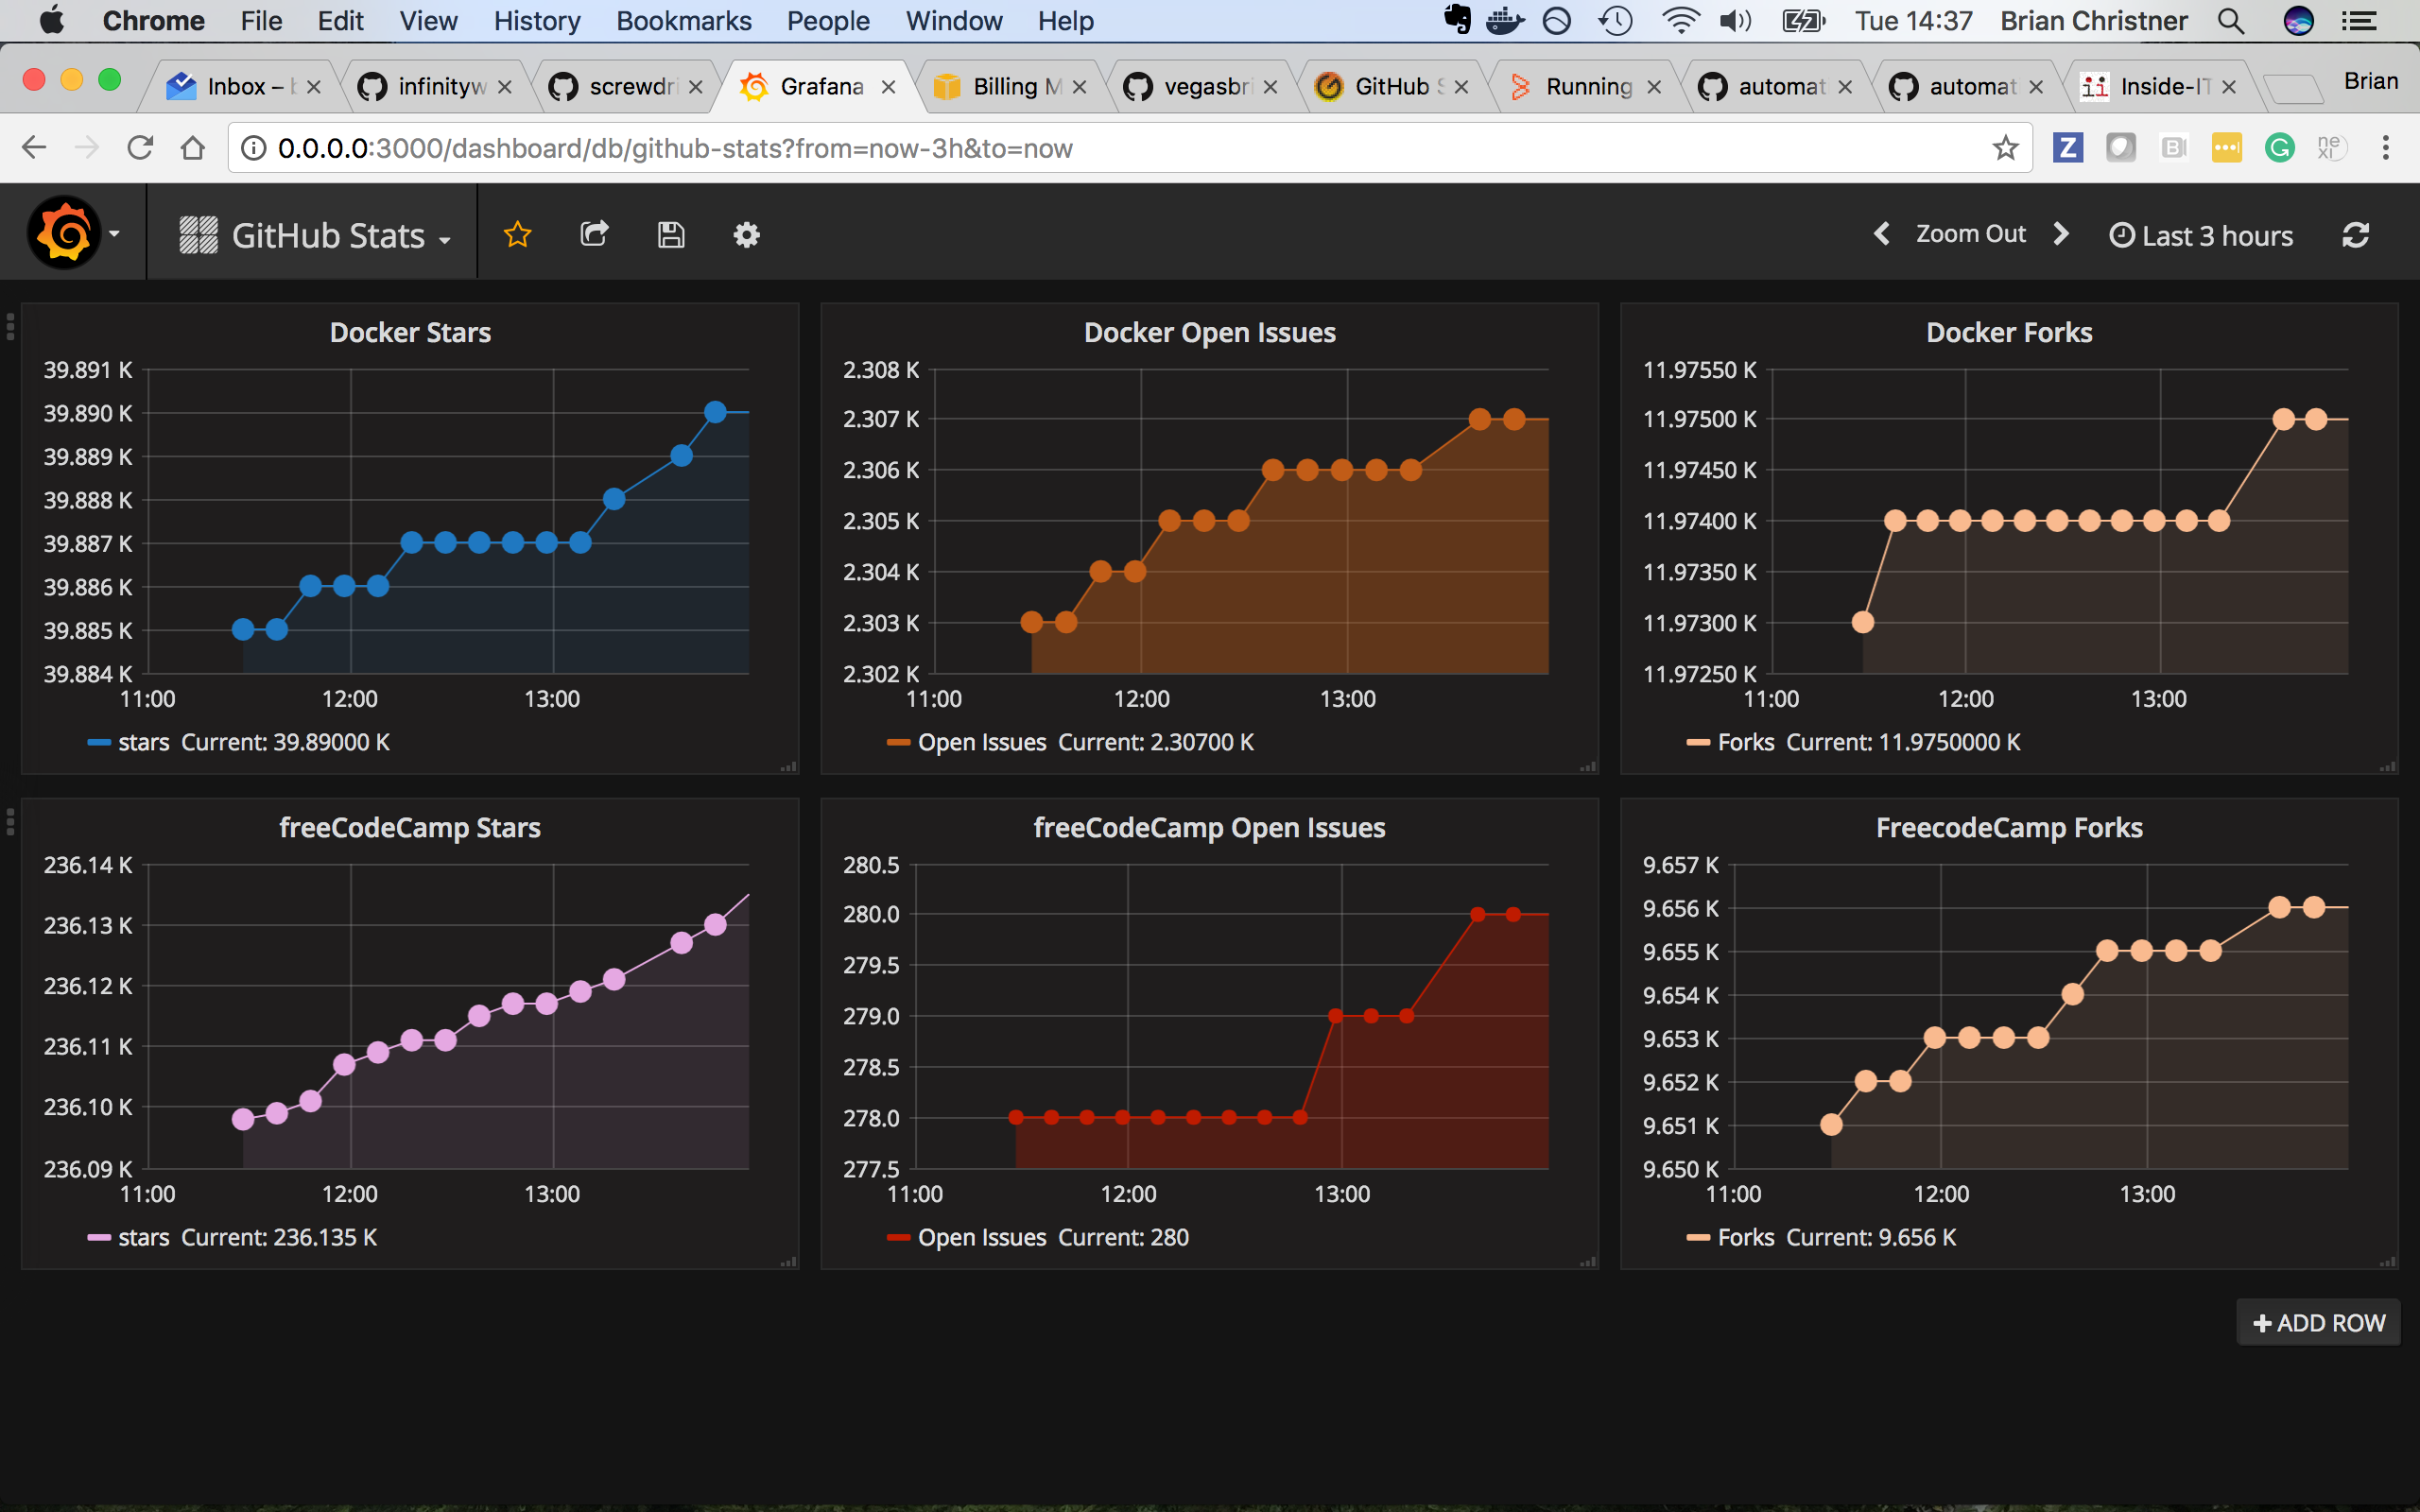
First, replace GITHUB_TOKEN=<GitHub API Token see README> with the token you generated earlier. Next, replace it with the REPOS , I REPOSyou want to track. In my example, I selected the Docker and freeCodeCamp REPOS as they offer lots of movement and stats.
metrics:
  tty: true
  stdin_open: true
 expose:
   - 9171
 image: infinityworks/github-exporter:latest
 environment:
  - REPOS=freeCodeCamp/freeCodeCamp,docker/docker
  - GITHUB_TOKEN=<GitHub API Token see README>
 networks:
  - back-tier
Once configurations are complete let's start it up. From the /github-monitoring project directory, run the following command:
$ docker-compose up
That's it. docker-compose builds the entire Grafna and Prometheus stack automagically. The compose file also connects the new GitHub Exporter to our baseline stack. I initially elected to run docker-compose without the -d flag flag. This makes it easier to troubleshoot and see logs printed to the terminal.
The Grafana Dashboard is now accessible via: http://<Host IP Address>:3000 for example http://localhost:3000
username - admin
password - foobar (The password is in the config.monitoring env file)
Post Configuration
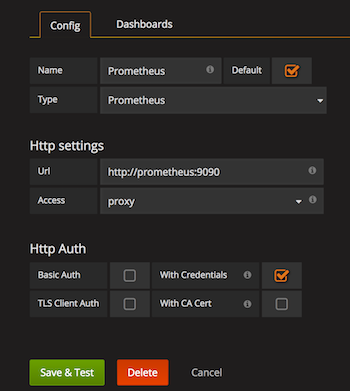
Now we need to create the Prometheus Datasource to connect Grafana to Prometheus
- Click the
GrafanaThe menu at the top left corner (looks like a fireball) - Click
Data Sources - Click the green button
Add Data Source.
Install Dashboard
I created a dashboard template that is available on the GitHub Stats Dashboard. Download the dashboard and select from the Grafana menu -> Dashboards -> Import.
This dashboard is a starting point for graphing your GitHub Repos. If you have any changes you would like to see in the Dashboard, let me know so I can update the Grafana site as well.
Conclusion
Prometheus in combination with Docker is a powerful yet simple to manage. The GitHub Exporter is one of the many amazing Exporters available to Prometheus. The next few articles I will select several more Exporters to show how easy they are to connect and graph data.
Follow me
If you liked this article, Follow Me on Twitter to stay updated!